Key benefits
Share your strategic goals with stakeholders
Spoom provides you with the framework to visualize and share your strategy with all stakeholders based on your vision and business structure. As management team, you draw the lines in the tool and each manager knows how he and his team can contribute to the growth of the company. The goal of a strategic plan is to execute it. Where plans often remain vague, Spoom gives you an overview of where you are now and where you want to go, based on data.
Set goals and forecast feasibility while working as one
Each manager has the opportunity to add their own projects and goals to the tool and immediately see if they are in line with the company vision, while the management team has an overview of all KPIs and their impact. This enables them to identify ongoing actions and KPIs that will have a short-, medium- or long term influence on the company results. Spoom's powerful analytical capabilities allow you to make connections between data from different sources and departments in order to perform risk management or discover opportunities to optimally manage teams and projects.
Tracking multiple data sources in one tool
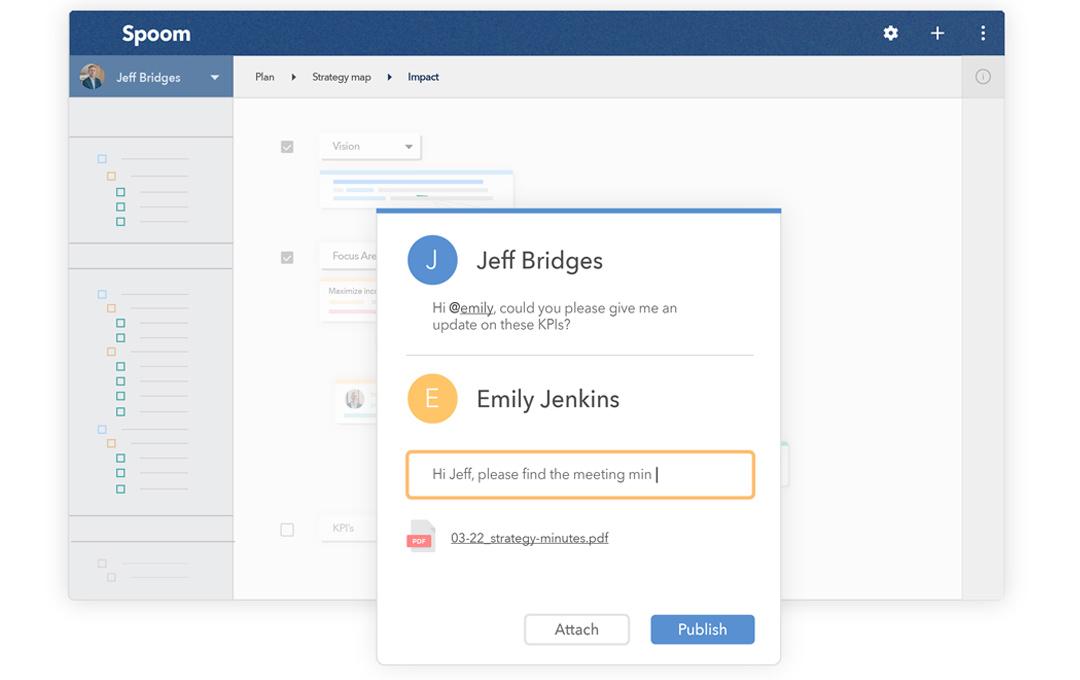
Whether your data comes from an Excel file, a BI tool, a CRM platform, or it is imported automatically or updated manually: Spoom handles it all. It's the ideal platform to create the link between executive committees, data systems and initiatives. Numbers don't always say everything, despite various data visualization methods and a powerful data engine. Spoom gives you context by adding comments with underlying information for those who want it to. Create clarity and take the right decisions, together.
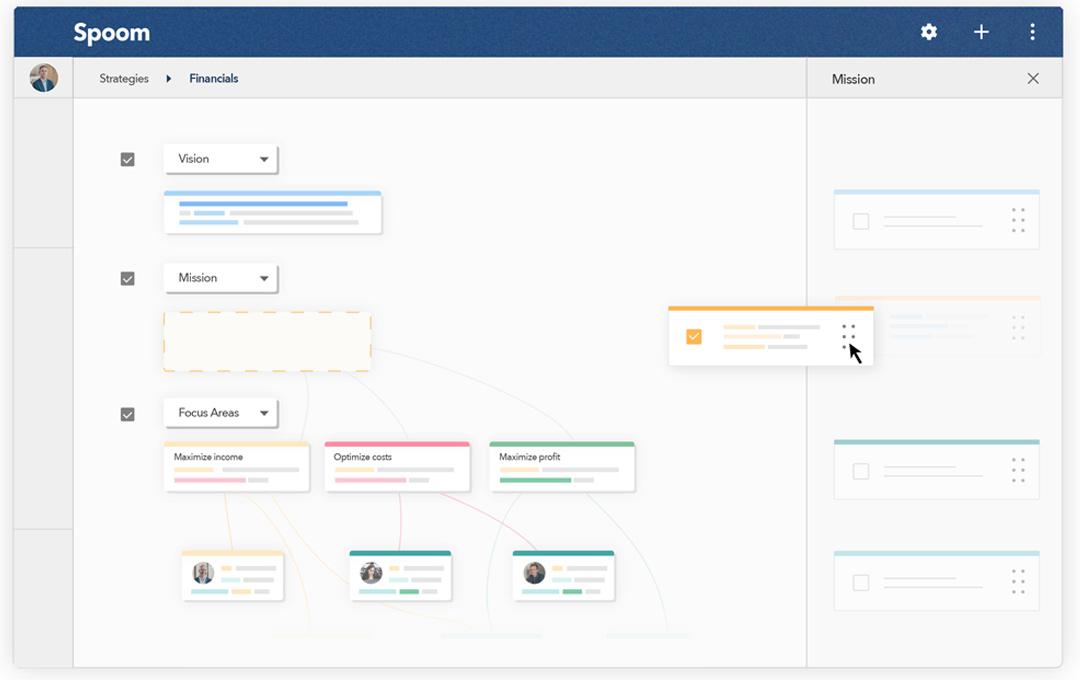
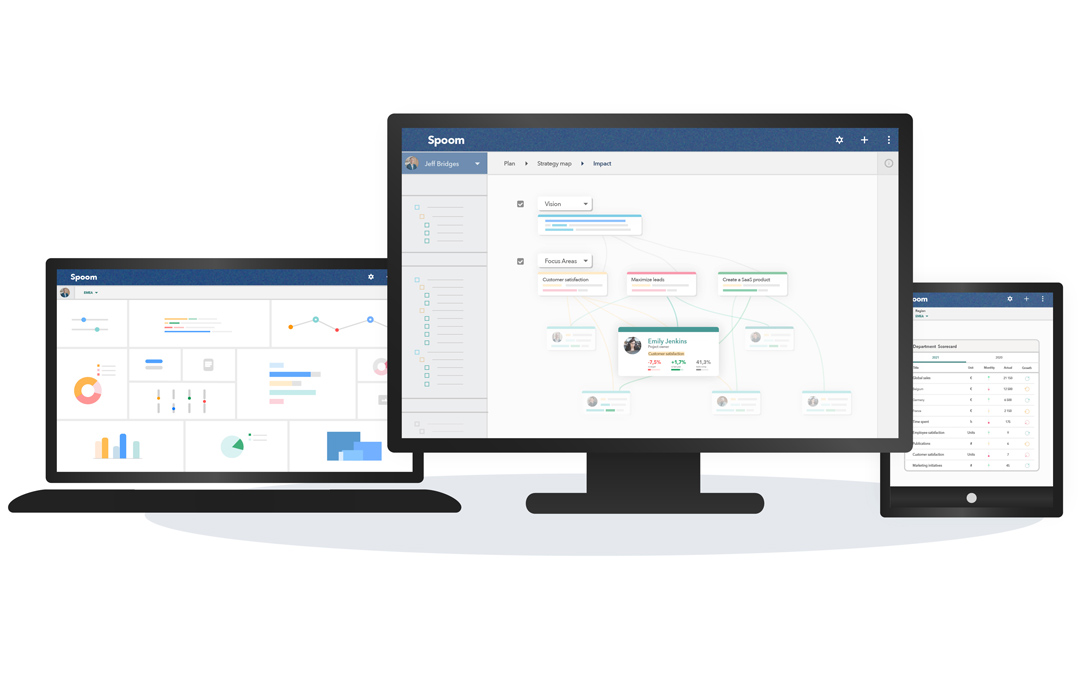
Visualize strategy & link objectives
Outline the foundations on which your business model rests and add them to your customized Strategy Map. Where do you want to be and where are you now? Spoom makes it visible. By sharing this with the stakeholders, everyone can ambitiously contribute ideas and plans to reach business objectives.
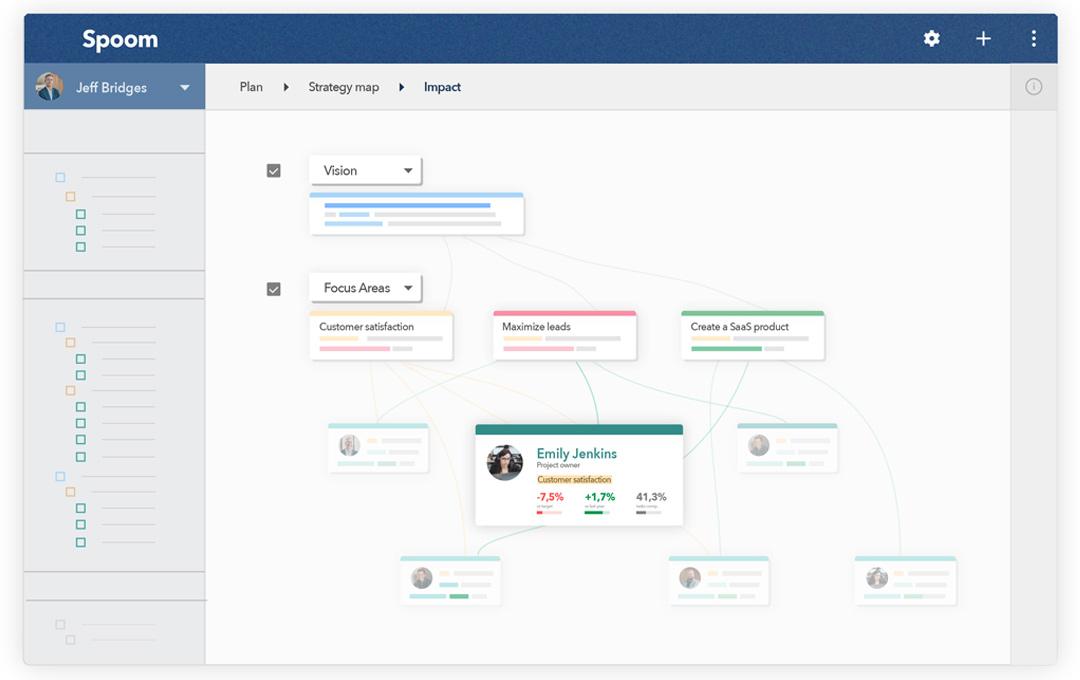
Localize reports and KPIs by department
Pour all the reports and KPIs that really matter into your Strategy Map. Make links between the present, the future-state, the various departments and the defined goals. So both management and each manager has a view of how his or her department is contributing to the success.
Don't just focus on profit and revenue - break down silos
More than an ordinary Business Intelligence solution
Spoom offers insights from data from different departments. Both Quantitative data (HR: number of employees and seniority, Marketing and Sales: Leads and funnel feeding, Finance: turnover and credit notes, Consultants: Intervention time, etc). As Qualitative data (employee satisfaction, customer satisfaction, etc.) Only in this way you can find underlying value and make your company achieve its full potential.
Focus your reports on what really matters
Spoom crosses data through different possible axes thanks to its analytical power. Thanks to algorithms it adds several dimensions including tolerance values. In a cascaded overview it displays your lagging and leading KPIs, which ensures that your planning is always complete and can be adjusted when necessary based on the data available in the tool. That data can come from any source:
-
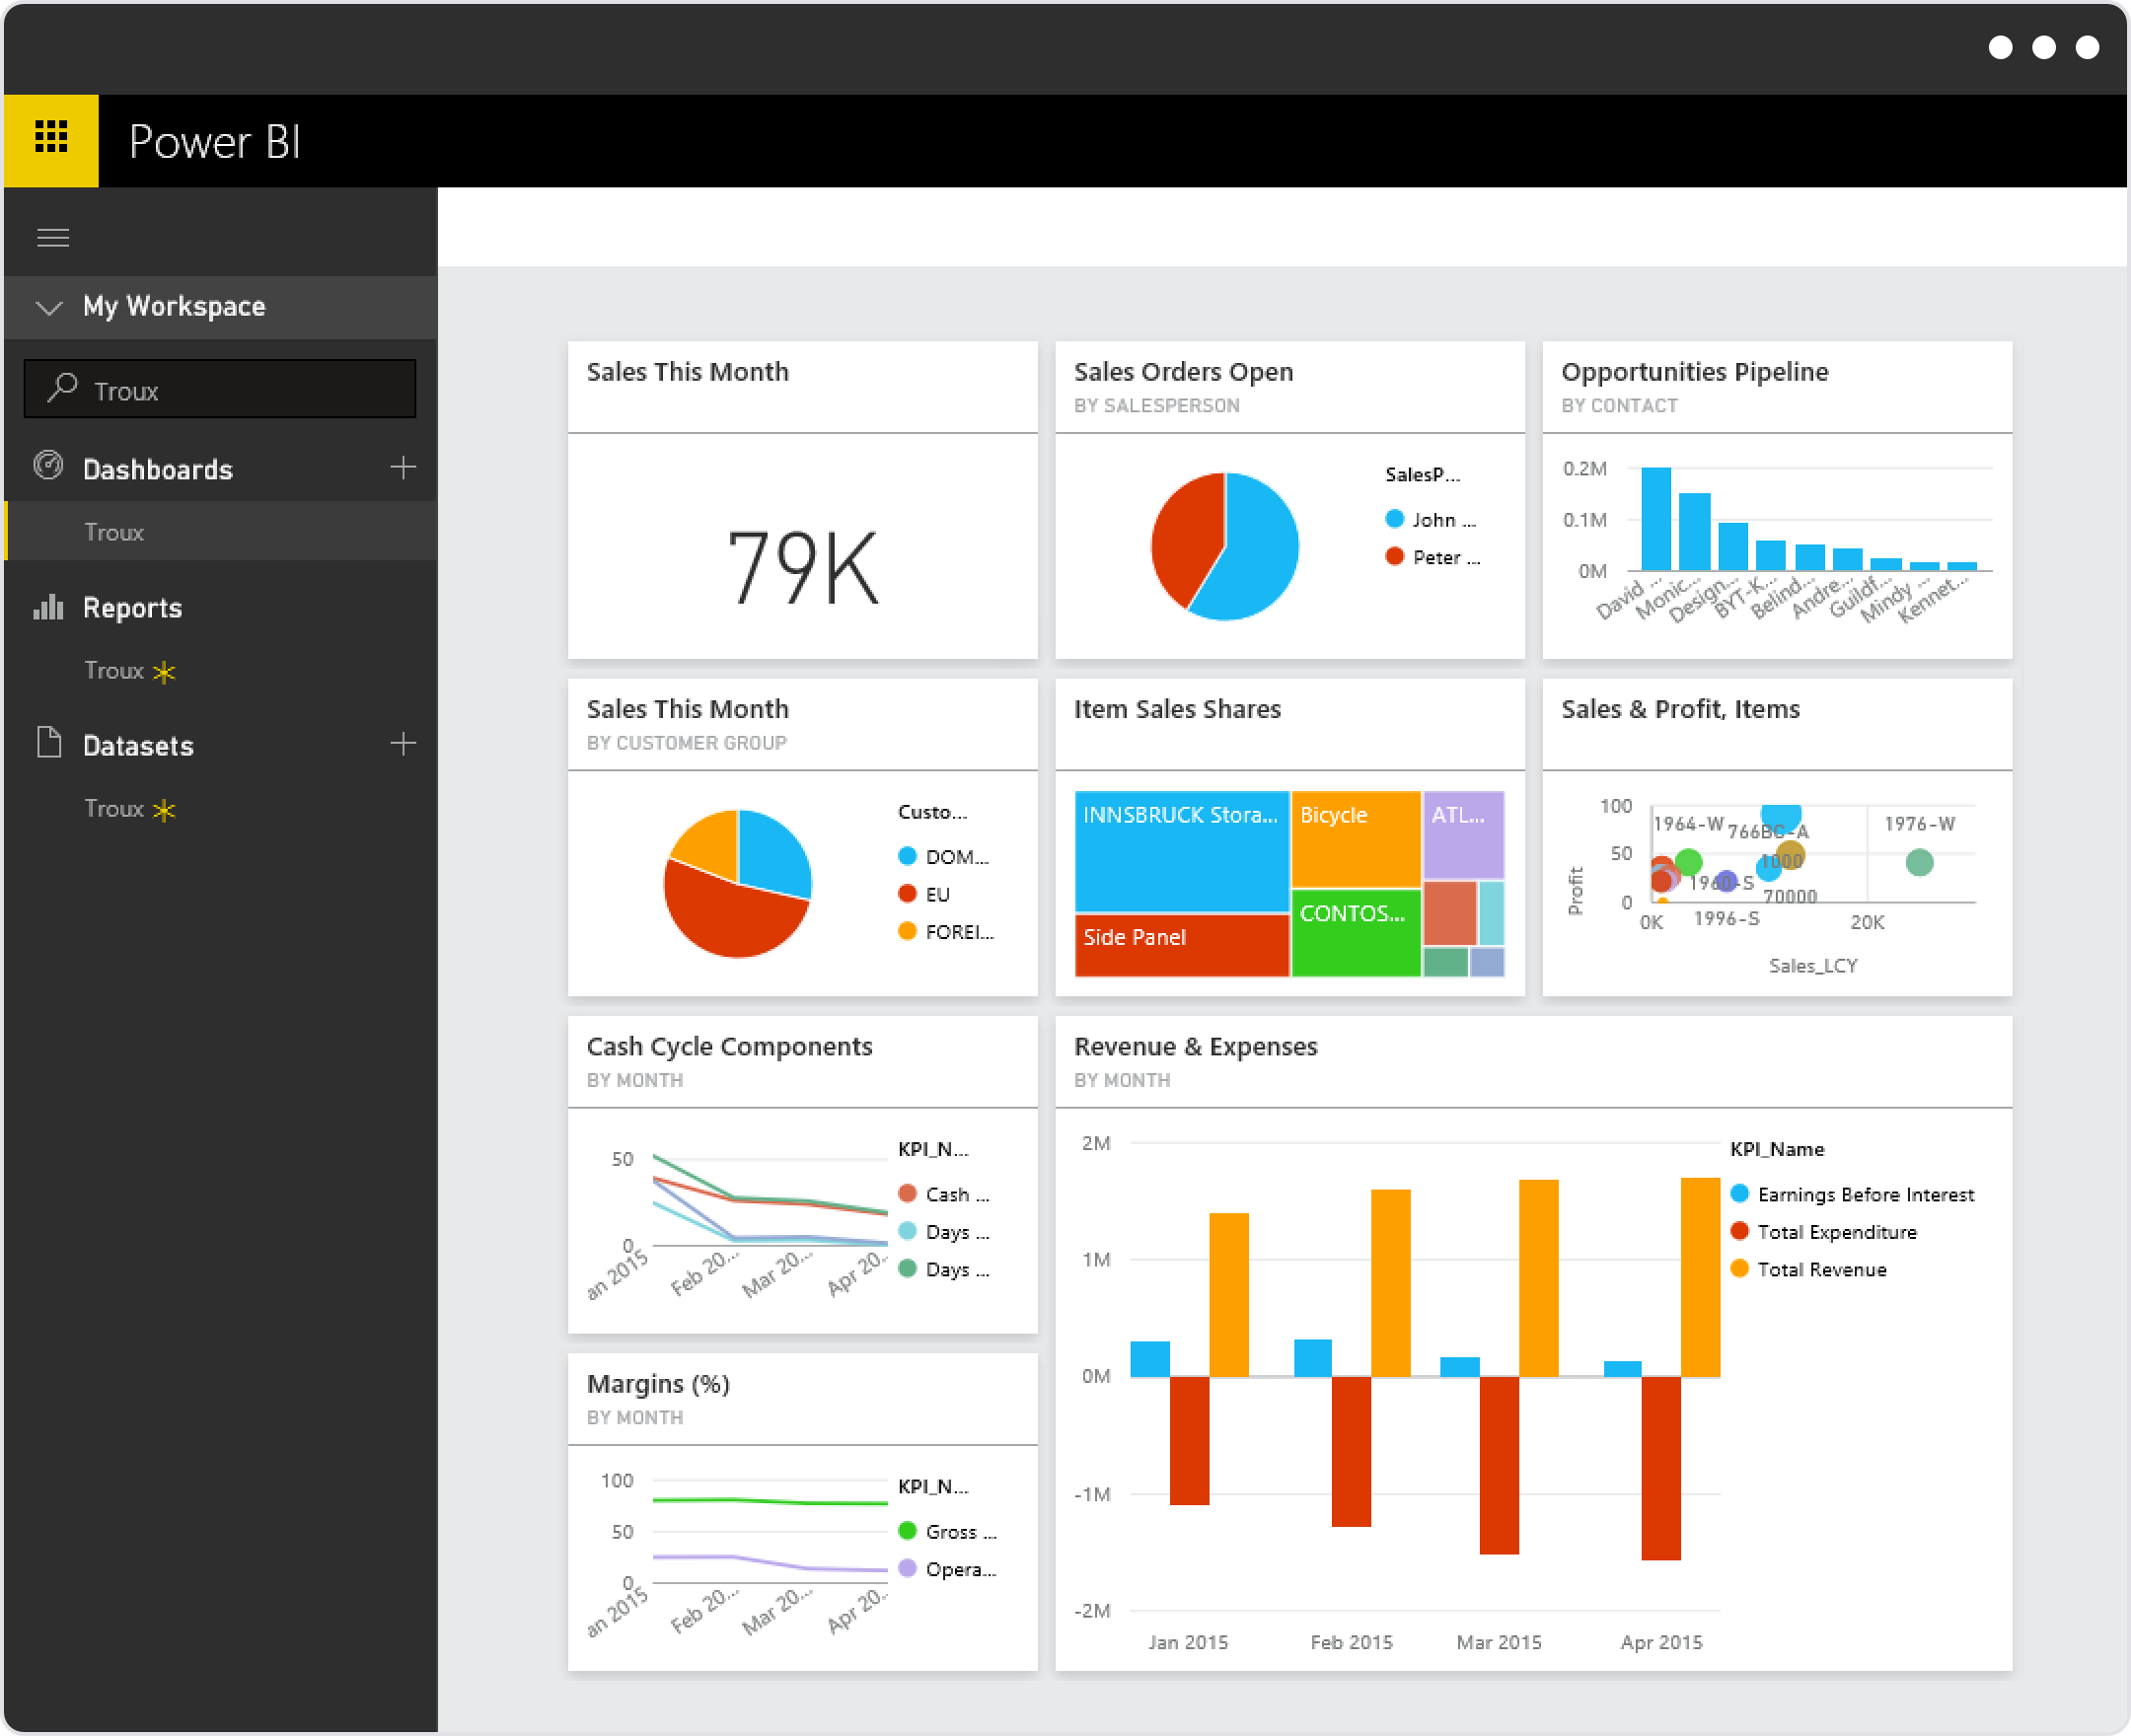
Business Intelligence
Whether you have a mature BI that is rooted throughout the organization, or different departments use different tools (Power BI, Qlik, Tableau, Cognos, etc), our experts know how to handle it. Everything can be integrated. We can even help you optimize your data.
-
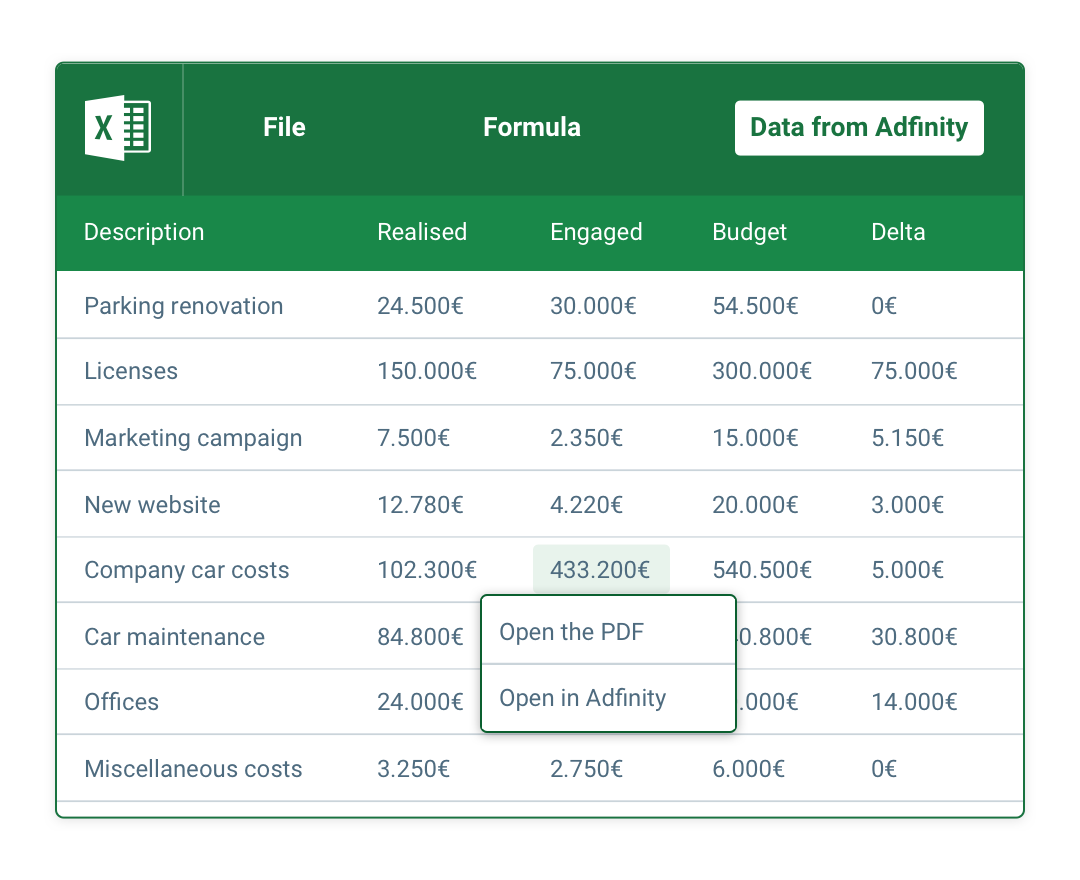
Microsoft Excel
Take data from Excel to the next level and integrate it into your strategic dashboard. Whether the data is updated manually from Excel, or directly in Spoom, or imported automatically, that's up to you. Your employees can continue to work in their favorite tool while you as management team keep the overview in your strategy execution software.
-
Business tools
Accounting software, CRM packs, customer service tools, marketing software, complex SQL databases, custom applications, everything can be integrated to keep everyone functioning optimally. Spoom's data stream architecture is set up to be hybrid, You can deep-dive into the raw data to put together your own analysis and dashboards.
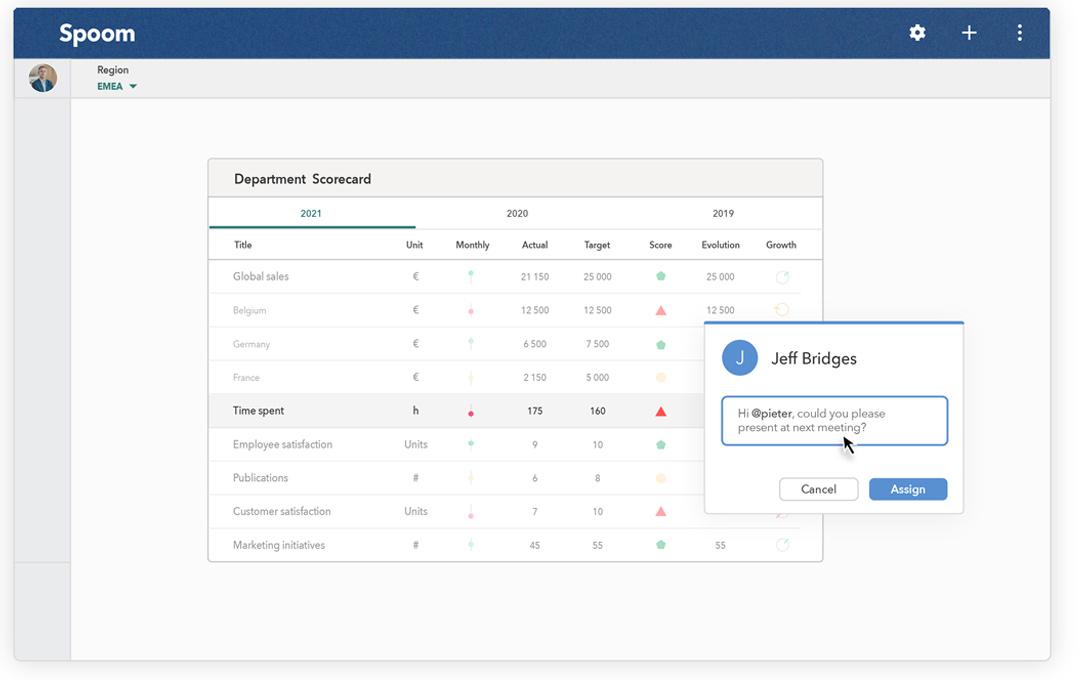
Build strategy dashboards
Build strategy dashboard with a little help from us our all by yourself. Visualize data any way you want from tables, heatmaps, forecasts, pie-charts to cascading map with figures that show impacts on projects or decisions. You'll love our balanced scorecards that give you a 360° view on your strategic management.
Planning & project risk-management
At each point you have insights into the impact of a KPI thanks to color codes and snackable data that will indicate risks that were defined by you or by the software.
Forecast upcoming investments
The impact map enables you to perform "Top-down" navigation to identify the key performance indicators and actions that will have a medium-term influence on the results.
Get priorities straight
New projects or ambitious ideas can be checked off immediately, thanks to your strategy map. Link them to objectives and see immediately how and if it will contribute to your vision.
"This meeting could have been a Spoom comment"
No need for unnecessary meetings about presenting numbers or progress. With Spoom, you get everyone in the loop with just one comment. No more misunderstandings, no more colleagues talking about the same KPI in different contexts. You can chat back and forward in real-time. Still need to have a meeting? Add meeting summaries of performance management meetings to Spoom with decisions right along, so every department manager gets up to speed in no time.
Accelerate your business growth and start here
Let's get in touch
Contact Mathieu and his team. Our Spoom Data experts will be happy to guide you through the tool using concrete examples with your data.
Get a quote
Curious about the pricing of Spoom? Contact us, and we'll be happy to make you an offer tailored to your situation and needs.